What NSFW AI Trends Say About Adult Chat in 2026
Read as a market signal rather than a menu, the trends board says three things about adult chat in 2026. Reach is concentrated in a small set of entries, with the busiest card showing 24.3M views against 7.1K favourites. Deliberate saving is rare by comparison, running between about 0.015 and 0.029 percent of views across the three cards read here on 22 Sept 2026. And the list itself is rewritten every Thursday, so what you see is a weekly snapshot rather than a standing order.

Key takeaways
- Reach is top-heavy: 24.3M, 19.1M and 18.2M views on the three cards read here, with favourites of 7.1K, 2.8K and 4.7K.
- The save rate band is narrow, roughly 0.015 to 0.029 percent, which makes outliers easy to identify rather than hard to guess.
- The chart covers 20 entries and refreshes weekly, so a reading is valid for about seven days before the sample changes.
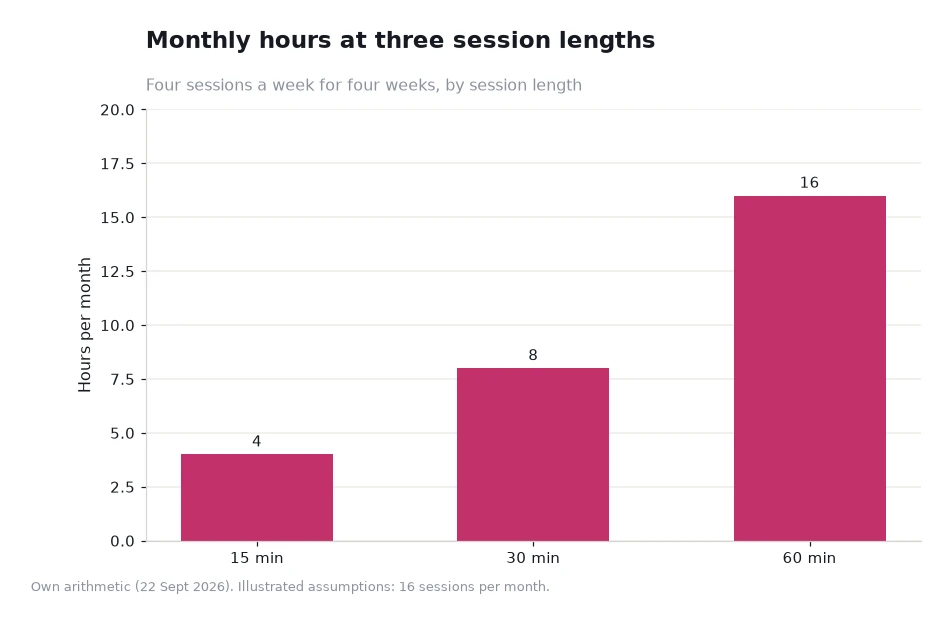
- Session time is a better planning unit than reach: four sessions a week of 15, 30 or 60 minutes is 4.0, 8.0 or 16.0 hours a month.
What the counters say about demand
Two counters per card produce a rough demand curve. Views measure how many readers were curious enough to open an entry, and favourites measure how many chose to keep it. In 2026, on this board, the gap between the two is large and consistent: 7.1K saves from 24.3M views, 2.8K from 19.1M, and 4.7K from 18.2M.
Convert each pair to a rate and the consistency becomes clearer. The busiest card converts at about 0.029 percent, the second at 0.015 percent and the third at 0.026 percent. A band that narrow tells you the board is curated to roughly the same standard of appeal rather than being a mix of runaway hits and also-rans.
What it does not tell you is retention. A save is a decision taken at one moment, and nothing in the counter records whether the character was opened again afterwards. Treat the counters as evidence of interest, not of satisfaction.
What the tags say about supply
The tag rows are where the board's editorial position becomes visible. The top NSFW AI characters carry labels such as Unfiltered, Submissive, Fictional, OC and Female, and each card displays a creator credit beneath the description. That combination says the catalogue is built by identifiable makers working an explicit style vocabulary, rather than being an unlabelled wall of entries.
The vocabulary also sets out the platform's own boundaries. The service describes itself as unfiltered, and its FAQ notes that some limitations apply in accordance with its content and community guidelines. Unfiltered here means the catalogue is not narrowed by default, not that anything goes — a distinction worth keeping in view when reading any 2026 summary of the category.
Provenance is settled separately. The platform's compliance statement, dated 8 Feb 2025, sets out that the material is AI-generated text and depicts no real person, which places the whole genre in a category of its own: adult fiction generated on request, with no photography or video of anyone involved.
| Signal | What the board shows | Cautious reading |
|---|---|---|
| View counters | 24.3M, 19.1M and 18.2M on the leading cards | Curiosity at scale, concentrated in a few entries |
| Favourite counters | 7.1K, 2.8K and 4.7K alongside those views | Deliberate saves are rare events by comparison |
| Save rate | About 0.015 to 0.029 percent | A narrow band that makes outliers visible |
| Tag vocabulary | Unfiltered, Submissive, Fictional, OC, Female | A labelled catalogue with identifiable creators |
| Refresh rhythm | A chart of 20 entries, rewritten every Thursday | Any reading has a shelf life measured in days |
Worked example: turning a market reading into a plan
Suppose you take the board at face value and want to plan your own use from it. Start with the rate: at roughly 0.026 percent, one save arrives for about every 3,800 views. Then set a habit against it. Four sessions a week for four weeks is 16 sessions, which at 15 minutes each is 240 minutes, or 4.0 hours a month.
Change only the session length and the time quadruples. At 30 minutes the same 16 sessions total 480 minutes, or 8.0 hours; at 60 minutes they total 960 minutes, or 16.0 hours. The reach numbers on the board do not change at all, because they describe the whole audience rather than you.
Then combine the two. A reader who keeps four characters a month from 16 sessions is producing one save per four sessions, which is an illustrated habit rather than a measurement. Over the six months to March that is 24 kept characters, a library that is both far tighter and far more personal than a board of 20 entries rewritten weekly.
Reading the board for yourself
The board at https://crushon.ai/trends/nsfw_ai is the primary source for everything above, and Crushon publishes it without an intermediary, so it is worth reading directly. Take three readings a month apart, note the counters and the tag rows, and compare them yourself. Three readings are enough to see whether a pattern is stable or simply this week's weather.
Two checks make the reading honest. First, separate reach from saving; a card with a huge view count and a middling save rate is being shown widely, not chosen often. Second, check the date on any summary you read, including this one. The counters here were read on 22 Sept 2026, and the chart they describe has been rewritten since.
For the surrounding mechanics, the character search page carries the trending tag list and the Thursday ranking schedule, while the AI chat blog holds the platform's own explanatory writing. Between them they cover the vocabulary and the cadence that make a market-level reading possible rather than impressionistic.
Three readings also protect against a common error in category writing, which is treating a single week's chart as a description of the whole market. A board of 20 entries rewritten weekly is a sample, and a sample of one week tells you what is being shown now rather than what the category is. The counters attached to the cards are the part worth comparing across readings, because they accumulate while the list is replaced.
Frequently asked questions
Does a big view count mean a better character?
No. It means more people opened the card. Saving behaviour is the closer signal, and even that only records a decision at one point in time.
How often is the board updated?
Weekly, on Thursdays, with a chart of 20 entries. Counters attached to individual cards move before the list itself changes.
Is 2026 different from earlier years?
The published structure — labelled entries, public counters, a weekly chart and an AI-text provenance statement — is the 2026 baseline. Read the pages yourself rather than relying on summaries of past years.
Take three readings before you conclude anything
Write down what the board shows today, then again in a month. Two readings give you a direction and three give you a trend. Anything faster than that is a reaction to a single data point.
The value of a market read is not a prediction. It is knowing which parts of a category are stable — the tag vocabulary, the save-rate band, the weekly cadence — and which parts are noise. Build your habits on the stable parts and let the rest pass.
Data and sources: card counters, tag rows and the 20-entry weekly chart on the trends board[1], with the Thursday ranking schedule and trending tags described on the search page and further platform guidance in the AI chat blog, all read 22 Sept 2026. Counters were read, and the arithmetic performed, on 22 Sept 2026; session figures are worked examples. Written for readers aged 18 and over; read 22 Sept 2026.